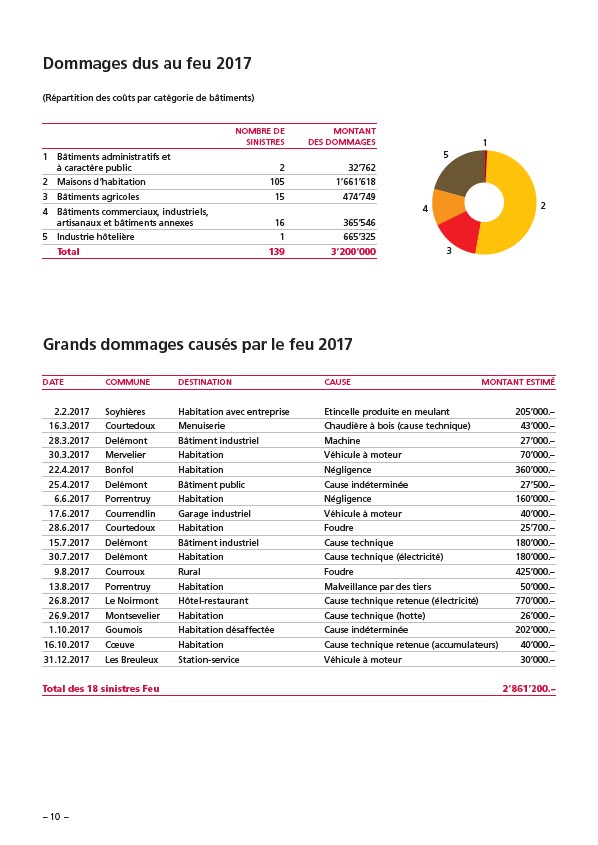
Dommages dus au feu 2017
(Répartition des coûts par catégorie de bâtiments)
Grands dommages causés par le feu 2017
DATE COMMUNE DESTINATION CAUSE MONTANT ESTIMÉ
2.2.2017 Soyhières Habitation avec entreprise Etincelle produite en meulant 205’000.–
16.3.2017 Courtedoux Menuiserie Chaudière à bois (cause technique) 43’000.–
28.3.2017 Delémont Bâtiment industriel Machine 27’000.–
30.3.2017 Mervelier Habitation Véhicule à moteur 70’000.–
22.4.2017 Bonfol Habitation Négligence 360’000.–
25.4.2017 Delémont Bâtiment public Cause indéterminée 27’500.–
6.6.2017 Porrentruy Habitation Négligence 160’000.–
17.6.2017 Courrendlin Garage industriel Véhicule à moteur 40’000.–
28.6.2017 Courtedoux Habitation Foudre 25’700.–
15.7.2017 Delémont Bâtiment industriel Cause technique 180’000.–
30.7.2017 Delémont Habitation Cause technique (électricité) 180’000.–
9.8.2017 Courroux Rural Foudre 425’000.–
13.8.2017 Porrentruy Habitation Malveillance par des tiers 50’000.–
26.8.2017 Le Noirmont Hôtel-restaurant Cause technique retenue (électricité) 770’000.–
26.9.2017 Montsevelier Habitation Cause technique (hotte) 26’000.–
1.10.2017 Goumois Habitation désaffectée Cause indéterminée 202’000.–
16.10.2017 Coeuve Habitation Cause technique retenue (accumulateurs) 40’000.–
31.12.2017 Les Breuleux Station-service Véhicule à moteur 30’000.–
Total des 18 sinistres Feu 2’861’200.–
– 10 –
NOMBRE DE MONTANT
SINISTRES DES DOMMAGES
1 Bâtiments administratifs et
à caractère public 2 32’762
2 Maisons d’habitation 105 1’661’618
3 Bâtiments agricoles 15 474’749
4 Bâtiments commerciaux, industriels,
artisanaux et bâtiments annexes 16 365’546
5 Industrie hôtelière 1 665’325
Total 139 3’200’000
1
2
3
4
5