– 9 –
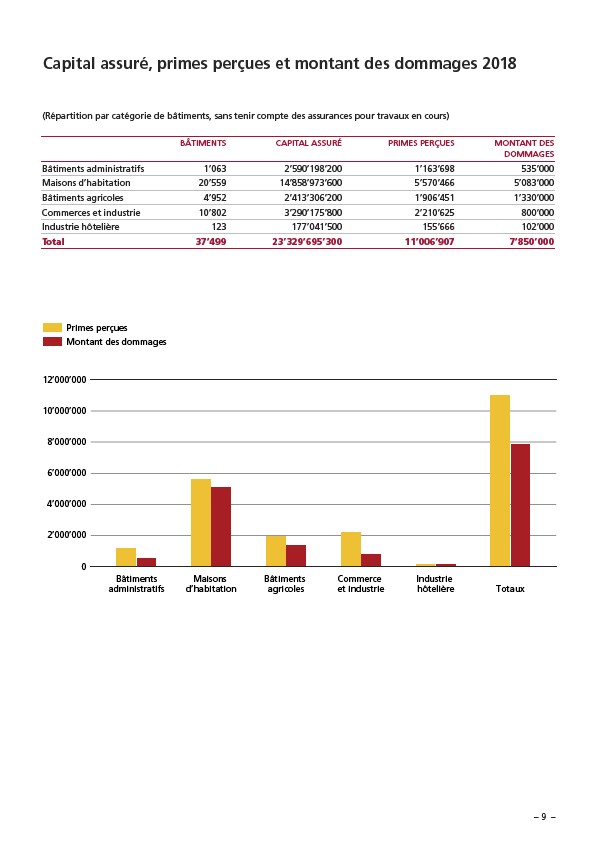
Capital assuré, primes perçues et montant des dommages 2018
(Répartition par catégorie de bâtiments, sans tenir compte des assurances pour travaux en cours)
BÂTIMENTS CAPITAL ASSURÉ PRIMES PERÇUES MONTANT DES
DOMMAGES
Bâtiments administratifs 1’063 2’590’198’200 1’163’698 535’000
Maisons d’habitation 20’559 14’858’973’600 5’570’466 5’083’000
Bâtiments agricoles 4’952 2’413’306’200 1’906’451 1’330’000
Commerces et industrie 10’802 3’290’175’800 2’210’625 800’000
Industrie hôtelière 123 177’041’500 155’666 102’000
Total 37’499 23’329’695’300 11’006’907 7’850’000
Primes perçues
Montant des dommages
Bâtiments
administratifs
Maisons
d’habitation
Bâtiments
agricoles
Commerce
et industrie
Industrie
hôtelière Totaux
12’000’000
10’000’000
8’000’000
6’000’000
4’000’000
2’000’000
0